


Text description of the graphic: ‘Gaps in capability at a glance’

Introduction
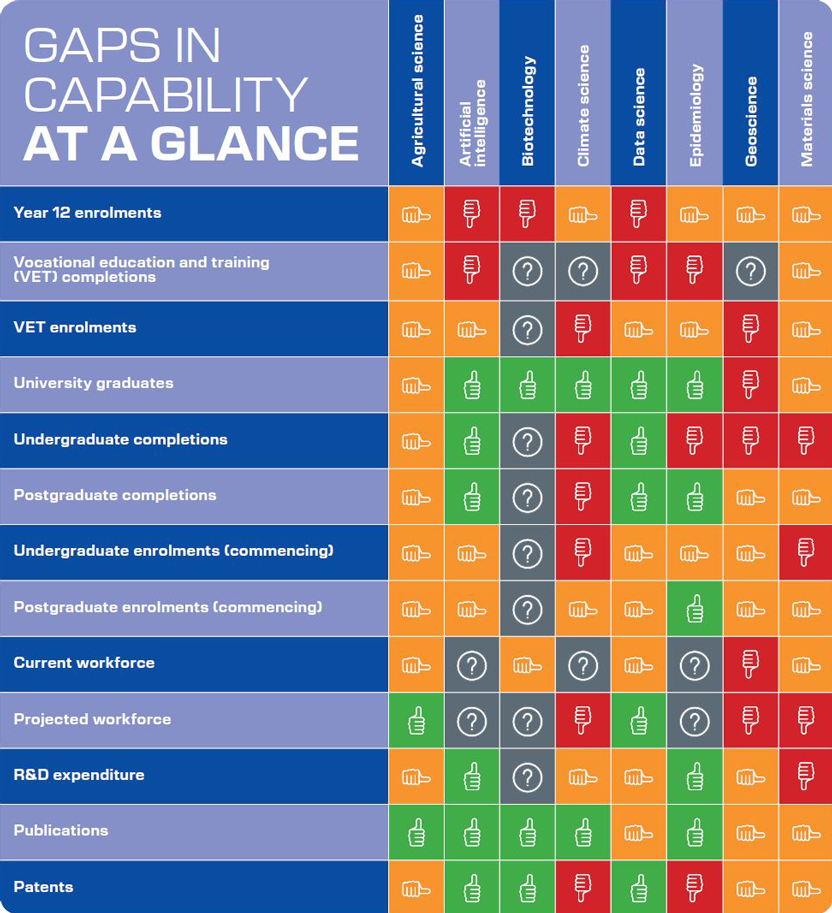
This is the text description of a key graphic in the Australian Academy of Science 2025 publication, Australian Science, Australia’s Future: Science 2035, and should be read in conjunction with that web page. This text description aims to improve the accessibility of the graphic for a broad audience. We’ve included the graphic at the bottom of this page, for reference.
There are eight science capabilities increasing most in demand over the coming decade. In alphabetical order they are (column headers in the graphic):
- Agricultural science
- Artificial intelligence
- Climate science
- Biotechnology
- Data science
- Epidemiology
- Geoscience
- Materials science
For each of these eight science capabilities, we rate their current situation using the following 13 measures (rows headers in the graphic):
- Year 12 enrolments
- Vocational education and training (VET) completions
- VET enrolments
- University graduates
- Undergraduate completions
- Postgraduate completions
- Undergraduate enrolments (commencing)
- Postgraduate enrolments (commencing)
- Current workforce
- Projected workforce
- R&D expenditure
- Publications
- Patents
The graphic is set up like a table with rows and columns to convey information. The graphic can be read both down columns and across rows. If you read down columns, you see how each one of the eight science capabilities is performing for each of the 13 measures. If you read across rows, you can compare how each one of the 13 measures is performing for each science capability.
How the measures are performing is show graphically, not using data. The following is used as the rating scale for the performance of each of the 13 measures:
- Green thumb (drawing of a thumb up, meaning good): A green thumb means no trends decreasing. No gap or unlikely to have a gap in capability.
- Amber thumb (drawing of a thumb sideways, meaning so-so): Some trends decreasing or no majority of increasing trends. Some gap or likely gap in capability.
- Red thumb (drawing of a thumb down, meaning poor): Most trends decreasing. Existing gap or certain gap in capability.
- Grey question mark (drawing of a question mark): Insufficient data available.
In summary, the green indicates no capability gap is expected by 2035, amber (orange) suggests some existing gaps with likely future shortfalls, and red signifies existing gaps with certain future problems if the causes aren’t addressed. The grey question mark indicates insufficient data or codes to define this capability, which makes it more difficult to measure.
Text description of the graphic
Ok, from here down is all the information from the graphic as text, grouped by the eight science capabilities (column headers).
Agricultural science
Overall impression: Almost all amber, two green, no red or grey
- Year 12 enrolments: Amber (some gap or likely gap in capability)
- Vocational education and training (VET) completions: Amber (some gap or likely gap in capability)
- VET enrolments: Amber (some gap or likely gap in capability)
- University graduates: Amber (some gap or likely gap in capability)Undergraduate completions: Amber (some gap or likely gap in capability)
- Postgraduate completions: Amber (some gap or likely gap in capability)
- Undergraduate enrolments (commencing): Amber (some gap or likely gap in capability)
- Postgraduate enrolments (commencing): Amber (some gap or likely gap in capability)
- Current workforce: Amber (some gap or likely gap in capability)
- Projected workforce: Green (no gap or unlikely to have a gap in capability)
- R&D expenditure: Amber (some gap or likely gap in capability)
- Publications: Green (no gap or unlikely to have a gap in capability)
- Patents: Amber (some gap or likely gap in capability)
Artificial intelligence
Overall impression: About half green, three amber, then two red and two grey
- Year 12 enrolments: Red (existing gap or certain gap in capability)
- Vocational education and training (VET) completions: Red (existing gap or certain gap in capability)
- VET enrolments: Amber (some gap or likely gap in capability)
- University graduates: Green (no gap or unlikely to have a gap in capability)
- Undergraduate completions: Green (no gap or unlikely to have a gap in capability)
- Postgraduate completions: Green (no gap or unlikely to have a gap in capability)
- Undergraduate enrolments (commencing): Amber (some gap or likely gap in capability)
- Postgraduate enrolments (commencing): Amber (some gap or likely gap in capability)
- Current workforce: Grey (insufficient data available)
- Projected workforce: Grey (insufficient data available)
- R&D expenditure: Green (no gap or unlikely to have a gap in capability)
- Publications: Green (no gap or unlikely to have a gap in capability)
- Patents: Green (no gap or unlikely to have a gap in capability)
Biotechnology
Overall impression: Majority grey, three green, one amber and one red
- Year 12 enrolments: Red (existing gap or certain gap in capability)
- Vocational education and training (VET) completions: Grey (insufficient data available)
- VET enrolments: Grey (insufficient data available)
- University graduates: Green (no gap or unlikely to have a gap in capability)
- Undergraduate completions: Grey (insufficient data available)
- Postgraduate completions: Grey (insufficient data available)
- Undergraduate enrolments (commencing): Grey (insufficient data available)
- Postgraduate enrolments (commencing): Grey (insufficient data available)
- Current workforce: Amber (some gap or likely gap in capability)
- Projected workforce: Grey (insufficient data available)
- R&D expenditure: Grey (insufficient data available)
- Publications: Green (no gap or unlikely to have a gap in capability)
- Patents: Green (no gap or unlikely to have a gap in capability)
Climate science
Overall impression: Around half red, three amber, two green and two grey
- Year 12 enrolments: Amber (some gap or likely gap in capability)
- Vocational education and training (VET) completions: Grey (insufficient data available)
- VET enrolments: Red (existing gap or certain gap in capability)
- University graduates: Green (no gap or unlikely to have a gap in capability)
- Undergraduate completions: Red (existing gap or certain gap in capability)
- Postgraduate completions: Red (existing gap or certain gap in capability)
- Undergraduate enrolments (commencing): Red (existing gap or certain gap in capability)
- Postgraduate enrolments (commencing): Amber (some gap or likely gap in capability)
- Current workforce: Grey (insufficient data available)
- Projected workforce: Red (existing gap or certain gap in capability)
- R&D expenditure: Amber (some gap or likely gap in capability)
- Publications: Green (no gap or unlikely to have a gap in capability)
- Patents: Red (existing gap or certain gap in capability)
Data science
Overall impression: Mostly green and amber, two red, no grey
- Year 12 enrolments: Red (existing gap or certain gap in capability)
- Vocational education and training (VET) completions: Red (existing gap or certain gap in capability)
- VET enrolments: Amber (some gap or likely gap in capability)
- University graduates: Green (no gap or unlikely to have a gap in capability)
- Undergraduate completions: Green (no gap or unlikely to have a gap in capability)
- Postgraduate completions: Green (no gap or unlikely to have a gap in capability)
- Undergraduate enrolments (commencing): Amber (some gap or likely gap in capability)
- Postgraduate enrolments (commencing): Amber (some gap or likely gap in capability)
- Current workforce: Amber (some gap or likely gap in capability)
- Projected workforce: Green (no gap or unlikely to have a gap in capability)
- R&D expenditure: Amber (some gap or likely gap in capability)
- Publications: Amber (some gap or likely gap in capability)
- Patents: Green (no gap or unlikely to have a gap in capability)
Epidemiology
Overall impression: Nearly half green, then three amber, three red and two grey
- Year 12 enrolments: Amber (some gap or likely gap in capability)
- Vocational education and training (VET) completions: Red (existing gap or certain gap in capability)
- VET enrolments: Amber (some gap or likely gap in capability)
- University graduates: Green (no gap or unlikely to have a gap in capability)
- Undergraduate completions: Red (existing gap or certain gap in capability)
- Postgraduate completions: Green (no gap or unlikely to have a gap in capability)
- Undergraduate enrolments (commencing): Amber (some gap or likely gap in capability)
- Postgraduate enrolments (commencing): Green (no gap or unlikely to have a gap in capability)
- Current workforce: Grey (insufficient data available)
- Projected workforce: Grey (insufficient data available)
- R&D expenditure: Green (no gap or unlikely to have a gap in capability)
- Publications: Green (no gap or unlikely to have a gap in capability)
- Patents: Red (existing gap or certain gap in capability)
Geoscience
Overall impression: Mostly amber and red, one grey, no green
- Year 12 enrolments: Amber (some gap or likely gap in capability)
- Vocational education and training (VET) completions: Grey (insufficient data available)
- VET enrolments: Red (existing gap or certain gap in capability)
- University graduates: Red (existing gap or certain gap in capability)
- Undergraduate completions: Red (existing gap or certain gap in capability)
- Postgraduate completions: Amber (some gap or likely gap in capability)
- Undergraduate enrolments (commencing): Amber (some gap or likely gap in capability)
- Postgraduate enrolments (commencing): Amber (some gap or likely gap in capability)
- Current workforce: Red (existing gap or certain gap in capability)
- Projected workforce: Red (existing gap or certain gap in capability)
- R&D expenditure: Amber (some gap or likely gap in capability)
- Publications: Amber (some gap or likely gap in capability)
- Patents: Amber (some gap or likely gap in capability)
Materials science
Overall impression: Mostly amber, four red, no green or grey
- Year 12 enrolments: Amber (some gap or likely gap in capability)
- Vocational education and training (VET) completions: Amber (some gap or likely gap in capability)
- VET enrolments: Amber (some gap or likely gap in capability)
- University graduates: Amber (some gap or likely gap in capability)
- Undergraduate completions: Red (existing gap or certain gap in capability)
- Postgraduate completions: Amber (some gap or likely gap in capability)
- Undergraduate enrolments (commencing): Red (existing gap or certain gap in capability)
- Postgraduate enrolments (commencing): Amber (some gap or likely gap in capability)
- Current workforce: Amber (some gap or likely gap in capability)
- Projected workforce: Red (existing gap or certain gap in capability)
- R&D expenditure: Red (existing gap or certain gap in capability)
- Publications: Amber (some gap or likely gap in capability)
- Patents: Amber (some gap or likely gap in capability)
The graphic, for reference
Gaps in capability
The findings indicate gaps across all eight capabilities, shown below.
Rating scale for the graphic above:
- Green thumb: No trends decreasing. No gap or unlikely to have a gap in capability.
- Amber thumb: Some trends decreasing or no majority of increasing trends. Some gap or likely gap in capability.
- Red thumb: Most trends decreasing. Existing gap or certain gap in capability.
- Question mark: Insufficient data available.