
Josh Hixson
Research Scientist at the Australian Wine Research Institute
@hixson_josh
I know for some people a week-long data science school doesn’t sound like the most inviting idea but… firstly, it was held during winter—in Brisbane—so it was a chance to grab a bit of extra vitamin D. And secondly, as an activity supported by the Theo Murphy Initiative (Australia), the Research Data Science Winter School involved little personal cost. So now that we have covered the cheap, mid-winter trip to Brisbane, those who are here for the data—keep reading!
I have training in synthetic chemistry, so my experience in handling data is calculating a yield percentage and then making sure it remains associated with the right compound. So why go to a data school? Well, like most people, I have branched out since my uni days and I now work between disciplines, where definitions and methods differ and diverse types of data exist. I regularly pick up research topics where others have left off, so I have to quickly make sense of Excel sheets of numbers. As you can imagine, things can get out of hand quickly.
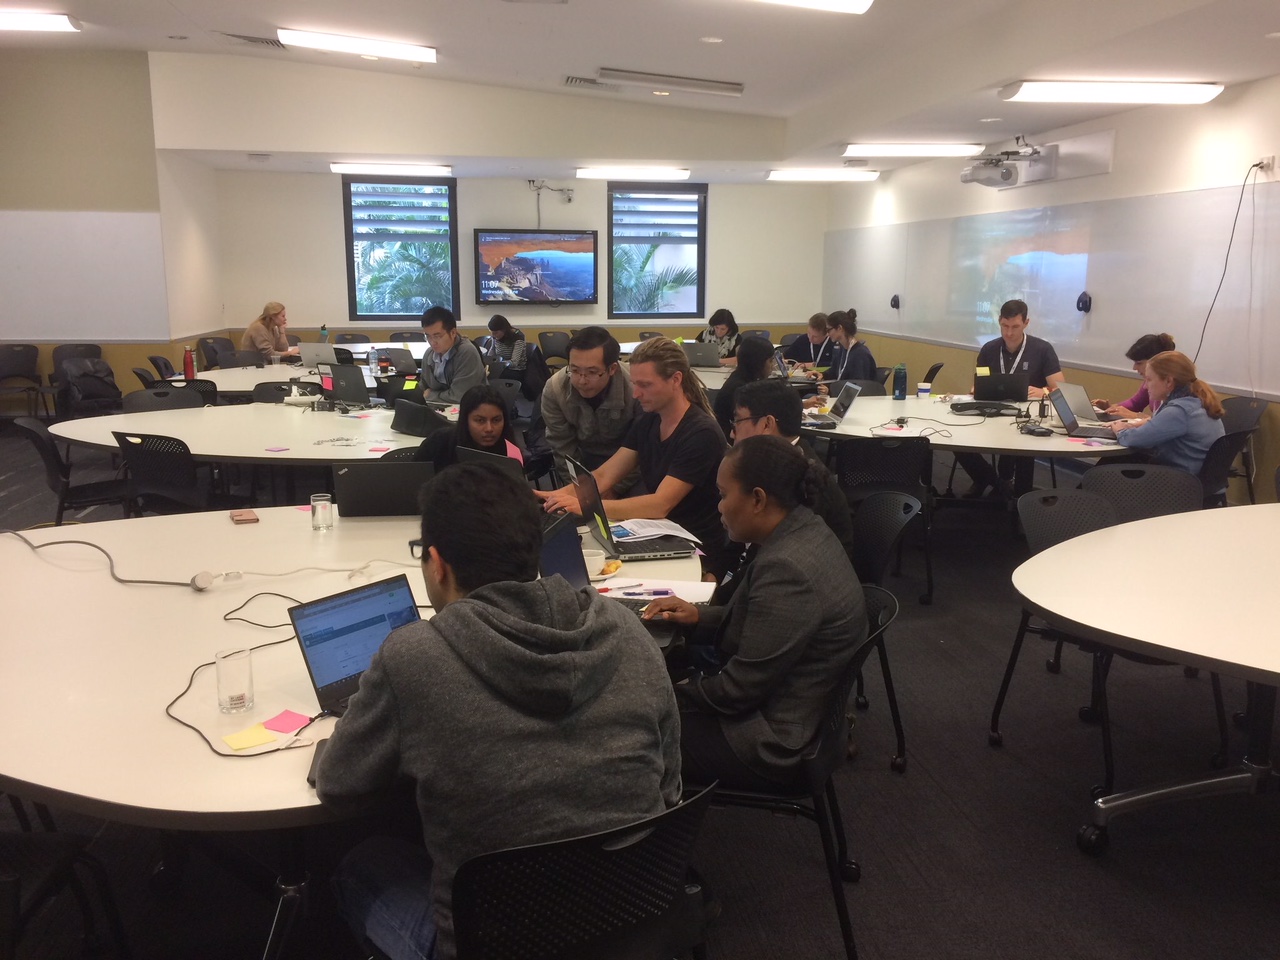
The first section was the practical: the workshops. This was where most of the time was spent—uncovering the tricks of the data science trade and providing a basic level of competency in things that I previously had no clue about (Unix shell, Git and high-performance computing… ) and where some of my base knowledge was (R, the statistical programming language). Much was taught by the dedicated people from Software Carpentry. Their material is open source and easily followed—check it out!
The second section bookended the week and was more philosophical. These are the topics that can have a profound impact in a short amount of time. Don’t get me wrong, the tools are extremely valuable, but generally only once you dedicate time to learn them. However, the principles of open data and science, FAIR (Findable, Accessible, Interoperable, Reusable) data, licensing and the associated tools and resources all exist on a spectrum and are, in some ways, attitude driven. As such, there is scope to make small changes to the way your data is considered to make it more open or more FAIR.
Our opening morning was an introduction to open data, including existential questions on the purpose of our existence in science. The philosophical argument is that we exist in science to contribute to the betterment of society through our discoveries and that we are often paid by the tax payers. So, why do we lock things behind paywalls or hide them away in folders on a server and only let people see the tip of the iceberg? This is not an argument I am going to get into… I am just highlighting the point to get to the fact that to achieve these goals, the best way is to make all of the data that we produce (note: not ‘our’ data, but everyone’s data) as open as possible.
There are external links provided below, so that the experts can better explain the key concepts from the school. A good, simple definition of open, shared and closed data is given by the Open Data Institute in a quick three-minute video. If you want to thoroughly cover off on the topic, have a look at the 12 principles of open data from Open Data in a Big Data World.
You may be asking ‘why share my data?’ This blog may help. For me personally, working in the agricultural sector, I regularly access data from government agencies like the Australian Bureau of Statistics or the Bureau of Meteorology, and I am thankful they release their data; it makes my job easier. Imagine what I could do if I had access to any data set I required (I would probably cry at how much data I had to look at). Obviously, there are some issues with truly open data that mean some things need to remain closed, like data that may identify individuals or in situations where there is a commercial interest. But the phrase we heard many times in the week was ‘as open as possible, as closed as necessary’.
FAIR stands for findable, accessible, interoperable and reusable. The best place to go to read more is the website of the wonderful people at the Australian National Data Service (ANDS). ANDS also has pages on sensitive data and a self-assessment tool to see how FAIR your data is.
Ideally, FAIR data should be on a global scale, but there are benefits from making your intra-institutional or intra-group data more FAIR. I think we are all guilty of having data hidden away in a few folders deep on a server somewhere. When the next person in the group comes along to do similar work the old data will probably be hard to find, contain little information about what the data means, what methods were used to generate it and what samples it was generated from (the metadata). As such, for a colleague it is not readily findable, possibly it is easy to access, however with no metadata it is not very re-usable, and if not in a common format, may not be interoperable. So what chance do we have of allowing this data to be useful for a collaborator (or even rival?) off site or halfway around the globe?
Here is where small changes can be made, and using the self-assessment tool above, data can be made a little bit more FAIR… or as FAIR as you are willing to go the first time. Additionally, in an ideal world a data management plan (DMP) is in place at an organisational or funding body level so you already have procedures in place. Failing that there are DMP projects that you can browse on the ANDS website if you don’t want to develop one from scratch. Once you have a DMP, you have started to make your data FAIR, it is relatively open, but how can you control how it is used? Well, my friend, welcome to licensing.
When we publish via traditional means we provide copyright to a journal. You can no longer even use your own figures as they now belong to the journal (we’ve all been there). Even more confusing is a case where no license conditions are stipulated (I figured no license statement was like no price tag on something—it’s free, right?). As it turns out, no license conditions stipulated means it’s all locked down. Luckily, any object that we can hand copyright over for, we can also license ourselves via Creative Commons licenses. You can simply choose how your presentations, pictures and, to some extent, manuscripts (the latter usually by journal choice or by paying open access fees) are licensed and apply the correct statements and pictograms. But it is still good to know what you are getting yourself in for.
The Know Your Rights chart is extremely helpful at quickly showing what we are allowing by using each license type. This chart is also held by a Creative Commons (CC) license, which tells me what I can do with it. In this case it is a CC BY license, which tells me that as long as I attribute the author (which is why I also clipped the author info and CC license statement and graphic) I can do what I want with it. I can change it, take parts of it, even use it in a commercial venture. The Creative Commons website has a pretty useful flowchart and license choosing tool that even provides you with text to embed into a webpage.
Looking at my last two publications, they are both held under Creative Commons license (open access), one CC BY and the other CC BY-NC-ND. With the first one (CC BY), you can take graphics out, use data to remake graphs, even make some cash out of what you produce, as long as you give attribution to the authors. In the second case (CC BY-NC-ND), you again need attribution (BY), as always, but you cannot make money from it (NC meaning ‘non-commercial’) and you can’t make modified versions of it (ND meaning ‘no derivatives’). So now I know what people can and can’t do with my work once it is out there, openly accessible and ready to be used to its full potential.
What have I actually taken from the 2018 Research Data Science Winter School?
Internally (that is, organisationally, not spiritually) I have:
Externally, I will:
I also feel an obligation to share the skills and knowledge I have developed during and since attending the Research Data Science Winter School. As such, any questions on the school itself, the topics or related… stuff, feel free to drop me a line on Twitter (@hixson_josh).
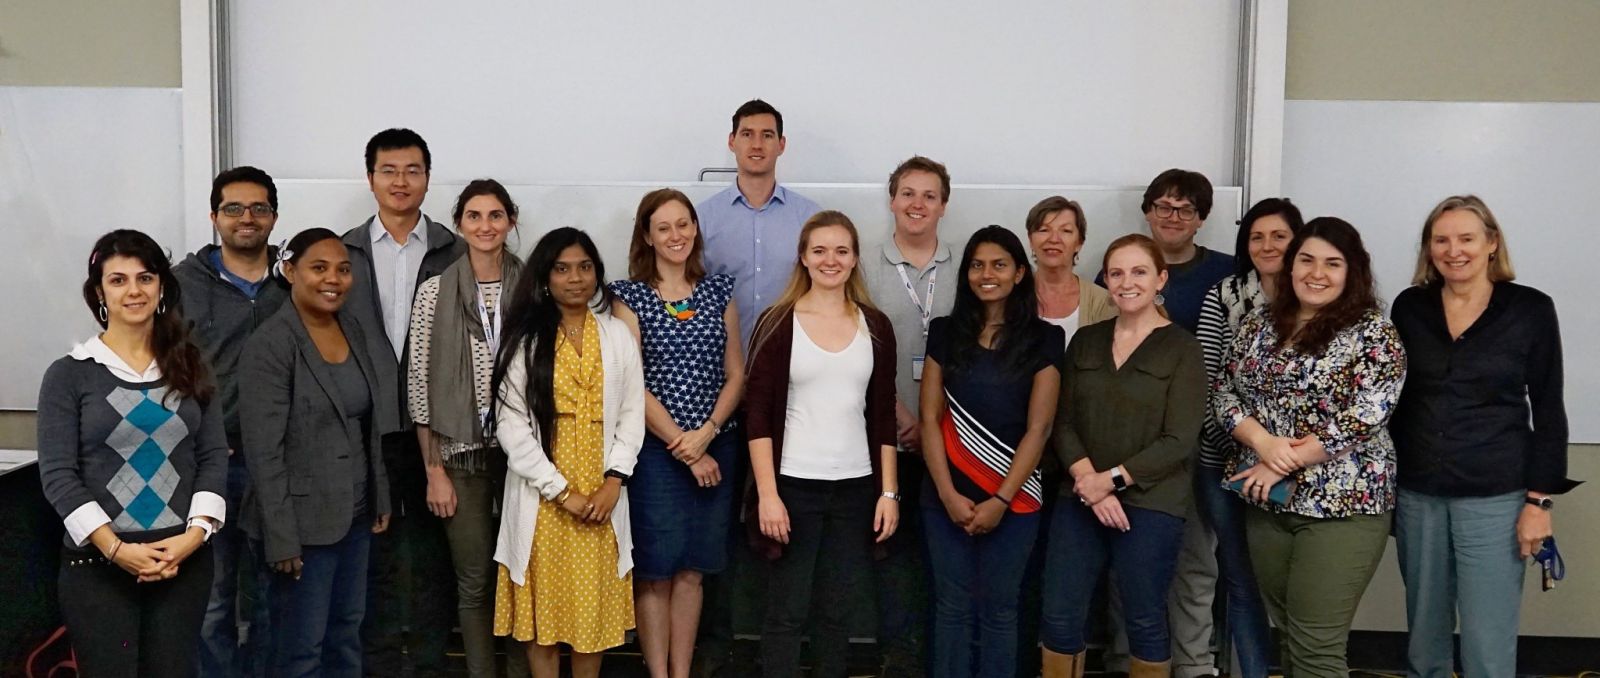
Obviously, this data school didn’t just happen. There were lots of people who worked very hard to make it successful. I don’t want to name names… mostly because I will forget someone and make them sad. There were more people dropping in to present and help with workshops than actually attended, just to make sure we had experts available for all of the topics covered (not to mention the epic amount of hands-on help I needed trying to understand the Unix shell). The Australian Academy of Science, the EMCR Forum and the Theo Murphy Initiative (Australia) are at the core of the school, but Software Carpentry, the University of Queensland and many others deserve a big round of applause for making this happen. The materials of the Winter School are currently available on the Academy website so make sure to check them out.
Also, if you have an idea for an activity that would benefit EMCRs, you can now submit your proposal for the 2019–20 round of the Theo Murphy Initiative (Australia). Applications are now open and will close on 11 November 2018.
© 2025 Australian Academy of Science

