
This is the financial report of the Australian Academy of Science for the year ended 30 June 2017. It includes a balance sheet for the financial year, as well as statements of comprehensive income, changes in equity and cash flows.
Download the financial report (PDF 1mb)
The Academy has posted an accounting surplus of $2,754,190 (2016 $167,860 deficit) for the year ended 30 June 2017 incorporating a non-cash change on fair value of the Investment Portfolio being an increase of $3,422,315 (2016 decrease of $431,657) and Impairment write down of specific Investments of $774,560 (2016 impairment of $925,417), resulting in a net surplus of $106,435, ($2016 loss of $599,517)
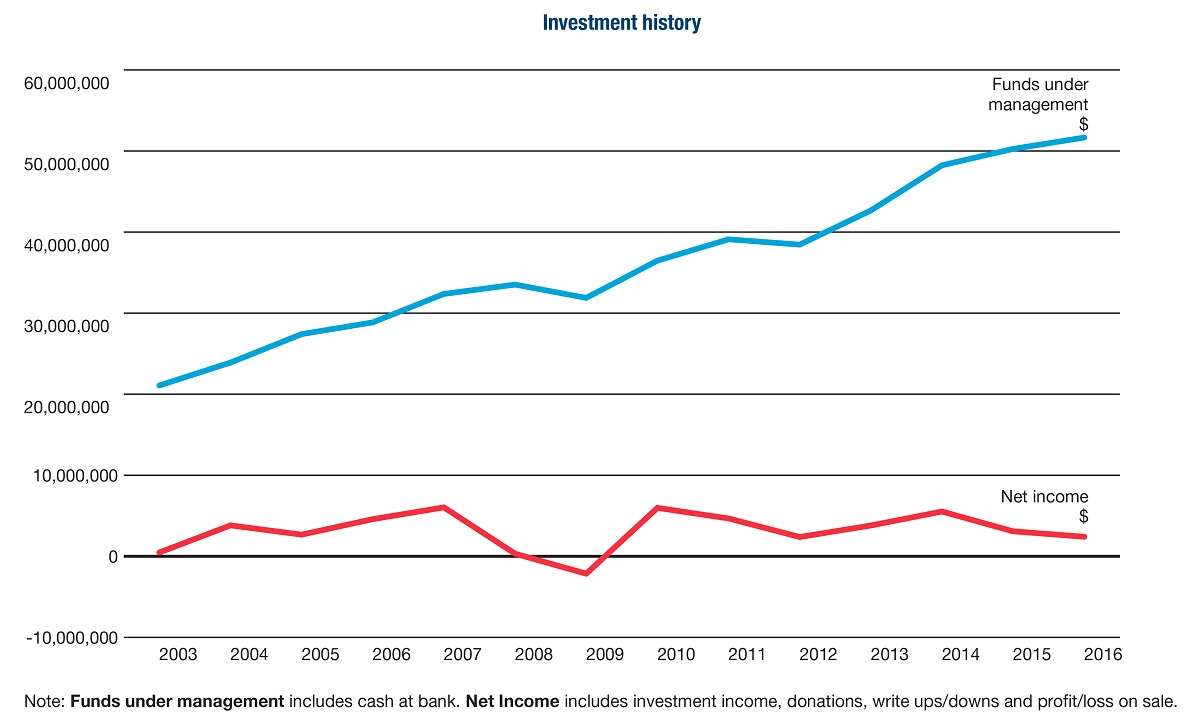
Compliance with accounting standards requires that significant changes in the market value of investments must be accounted for, but as the chart of funds under management illustrates, the trend in the value of the Academy’s endowments is upwards, reflecting the careful stewardship of these endowments. This financial result is an improvement on last years losses and the Academy is projecting surplus positions in future financial years, making more funds available for new initiatives.
Please see the below table detailing the Academy’s operating deficit and how it has been funded:
| Academy Operations | Untied Investments | Special Purpose Funds | Primary Connections (excluding grant and public good) | Total per Accounts | ||
|---|---|---|---|---|---|---|
| Income | ||||||
| Operational Income | $10,952,819 | $847,204 | $11,800,023 | |||
| Net Investment Income* | $914,466 | $1,805,492 | $28,347 | $2,748,305 | ||
| Donations** | $484,541 | $484,541 | ||||
| Total Income | $10,952,819 | $914,466 | $2,290,033 | $875,551 | $15,032,869 | |
| Expenses | ||||||
| Operational Expense | $12,733,796 | $1,300,532 | $14,034,328 | |||
| Impairment Loss | $774,560 | $774,560 | ||||
| Fund Expense | $115,571 | $776,535 | $892,106 | |||
| Total Expense | $12,733,796 | $890,131 | $776,535 | $1,300,532 | $15,700,994 | |
| Result | -$1,780,977 | $24,335 | $1,513,498 | -$424,981 | -$668,125 | |
| Other Comprehensive Income | $3,422,315 | $3,422,315 | ||||
| Total Comprehensive Income | -$1,780,977 | $3,446,650 | $1,513,498 | -$424,981 | $2,754,190 |
*NB – From 1 July 2015 capital movement has been apportioned between Special Purpose and Untied Funds (P264/14) resulting in the net allocation shown to Special Purpose Funds.
Untied Funds do not have allocation directly applied for purposes of reconciliation on this table.
**Primary Connections income does not include donations yet to be spent so this will differ from audited figures due to accounting treatment.
This shows that Academy operations cost $1.4 million and Primary Connections Operations $0.43 million, funded by net untied investment income of $1.44 million to the extent that grants did not cover expenditure. Please note that there were also some small transfers over the year from the Enlightening Fund to Academy Operations. This is a much better result than the prior year noting in particular that much of the untied expenses related to a large non cash impairment loss.
Performance to budget – The major positive variances can be attributed to:
Negative variances can be attributed to:
At the end of June 2017 the Academy employed 75 full time equivalent staff. The full audited accounts of the Academy are available on the Academy website (above) and a hard copy can be printed off for those who require one by calling the Academy Secretariat on 02 6201 9400.
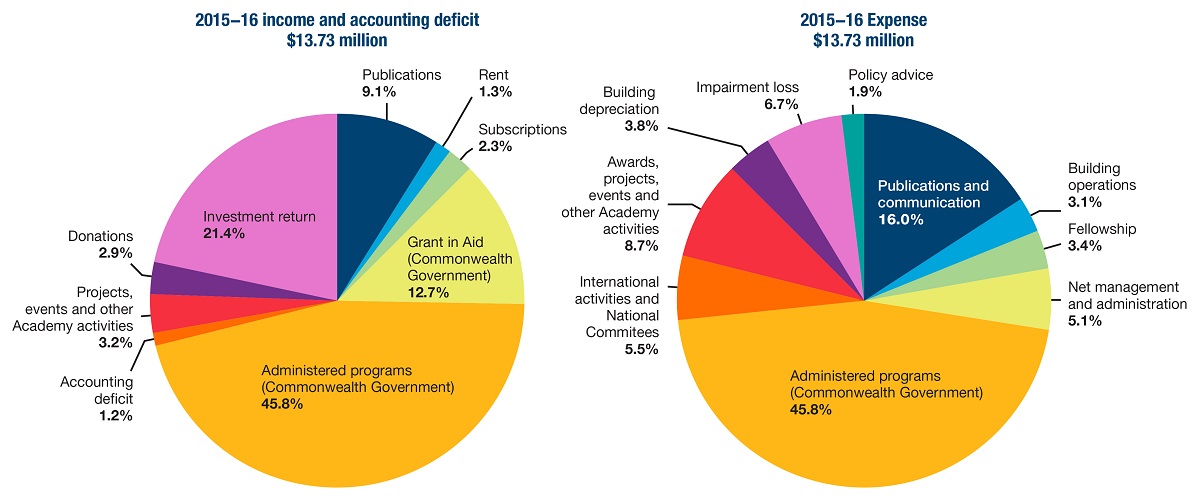
For a more detailed break up of income and expenditure please refer to the charts below.
© 2026 Australian Academy of Science
