
This is the financial report of the Australian Academy of Science for the year ended 30 June 2018. It includes a balance sheet for the financial year, as well as statements of comprehensive income, changes in equity and cash flows.
Download the financial report (PDF 5mb)
The Academy has posted an accounting surplus of $2,072,829 (2017 $2,754,189) for the year ended 30 June 2018 incorporating a non-cash change on fair value of the Investment Portfolio being an increase of $391,856 (2017 increase of $3,422,315) and Impairment write down of specific Investments of $229,554 (2017 impairment of $774,560), resulting in a net surplus of $1,910,527 (2017 $106,435).
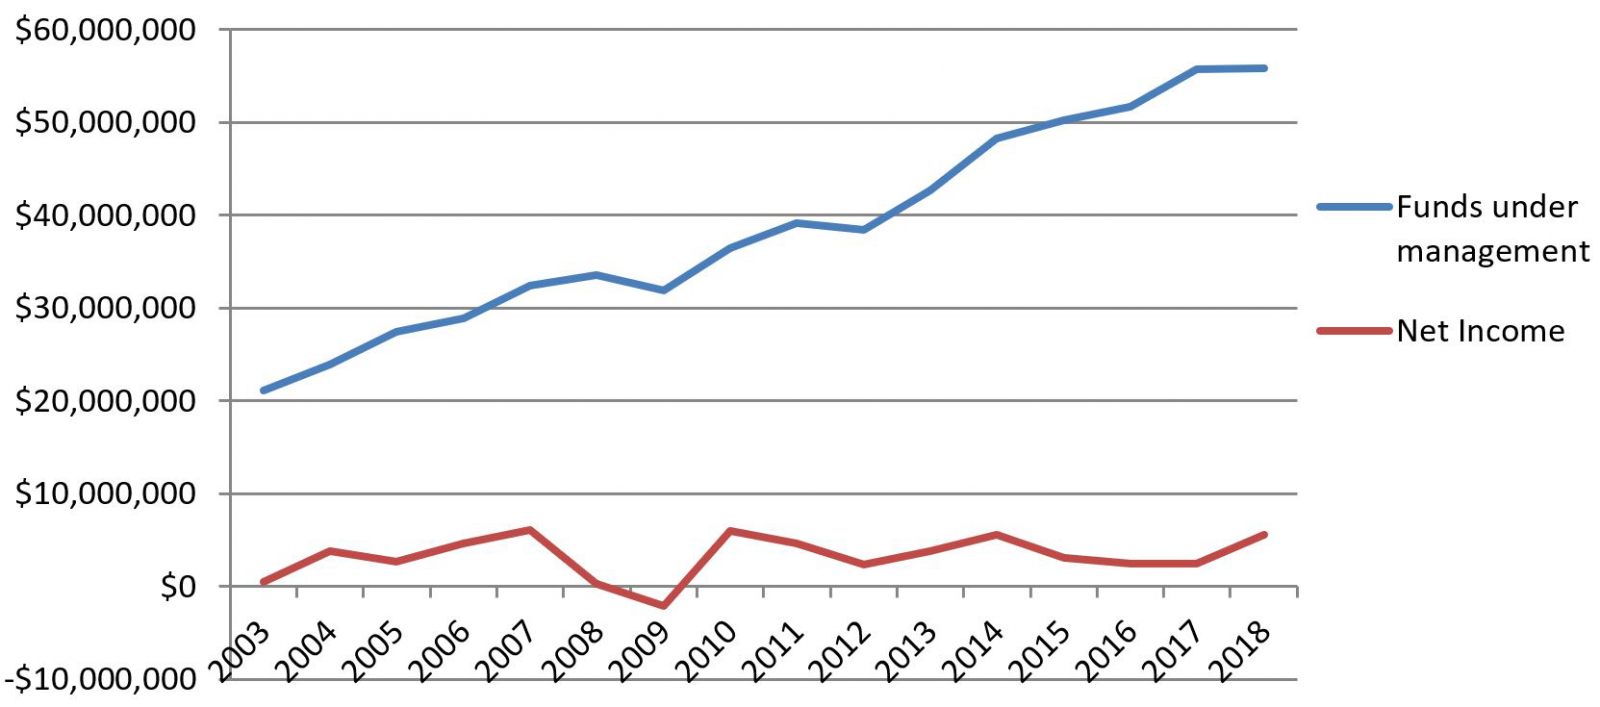
Compliance with accounting standards requires that significant changes in the market value of investments must be accounted for, but as the chart of funds under management illustrates, the trend in the value of the Academy’s endowments is upwards, reflecting the careful stewardship of these endowments. This financial result is attributed to Donations of $2.124m and the Academy is projecting surplus positions in future financial years, making more funds available for new initiatives.
Please see the below table detailing the Academy’s operating deficit and how it has been funded:
| Academy Operations | Untied Investments | Special Purpose Funds | Primary Connections (excluding grant and public good) | Total per Accounts | ||
|---|---|---|---|---|---|---|
| Income | ||||||
| Operational Income | $12,223,245 | $871,633 | $13,094,878 | |||
| Net Investment Income* | $2,492,744 | $1,130,648 | $18,947 | $3,642,339 | ||
| Donations | $2,124,209 | $2,124,209 | ||||
| Total Income | $12,223,245 | $2,492,744 | $3,254,857 | $890,580 | $18,861,426 | |
| Expenses | ||||||
| Operational Expense | $15,039,623 | $1,083,561 | $16,123,184 | |||
| Impairment Loss | $229,554 | $229,554 | ||||
| Fund Expense | $125,870 | $701,845 | $827,715 | |||
| Total Expense | $15,039,623 | $355,424 | $701,845 | $1,083,561 | $17,180,453 | |
| Result | -$2,816,378 | $2,137,320 | $2,553,012 | -$192,981 | $1,680,973 | |
| Other Comprehensive Income | $391,846 | $391,846 | ||||
| Total Comprehensive Income** | -$2,816,378 | $2,529,166 | $2,553,012 | -$192,981 | $2,072,819 |
Notes
*From 1 July 2015 capital movement has been apportioned between Special Purpose Funds and Investments.
Untied Funds do not have an income allocation for purposes of reconciliation of this table.
**Represents the amount allocated from the Investment Income for Academy Operations.
This shows that Academy operations cost $2.81 million and Primary Connections Operations $0.19 million, this was funded by net untied investment income of $2.90 million. This is consistent with the previous prior year noting in particular that much of the untied expenses related to an increase in Academy activity, such as Video Production and improvement of Academy facilities, in addition to a non-cash impairment loss. The financial position for Primary Connections was a deficit of $0.19 million, a marked improvement on the prior year. Primary Connections is anticipating a break-even position in the next financial year.
Performance to budget – The major positive variances can be attributed to:
Negative variances can be attributed to:
At the end of June 2018 the Academy employed 75 full time equivalent staff. The full audited accounts of the Academy are available on the Academy website (above) and a hard copy can be printed off for those who require one by calling the Academy Secretariat on 02 6201 9400.
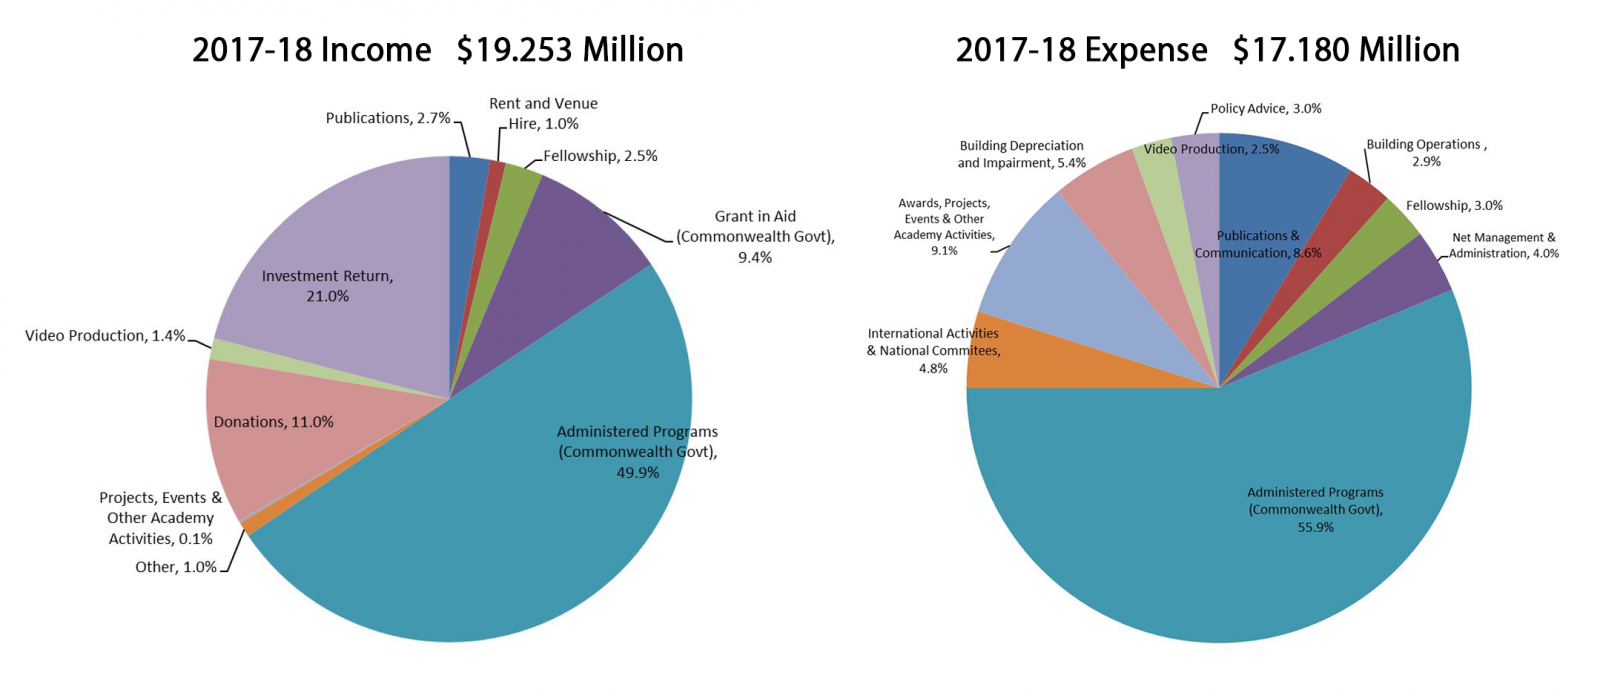
For a more detailed break up of income and expenditure please refer to the charts below.
Click images to expand.
© 2026 Australian Academy of Science
