Contents
View Dr Alicia Oshlack's photo gallery
You can order the DVD from the Academy for $15 (including GST and postage)
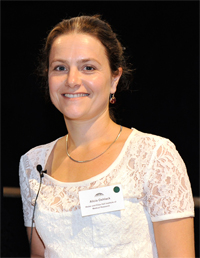
Dr Alicia Oshlack was interviewed in 2011 for the Interviews with Australian Scientists series. By viewing the interviews in this series, or reading the transcripts and extracts, your students can begin to appreciate Australia's contribution to the growth of scientific knowledge and view science as a human endeavour. These interviews specifically tie into the Australian Curriculum sub-strand ‘Nature and development of science’.
The following summary of Dr Oshlack’s career sets the context for the extract chosen for these teachers’ notes. The extract explains bioinformatics as a tool for understanding biological data, such as that generated by microarrays. Use the focus questions that accompany the extract to promote discussion among your students.
Alicia Oshlack was born in Roleystone, Perth in 1975. Oshlack graduated dux from Warrnambool College in 1993. She then went on to complete a Bachelor of Science (Hons) (1994-98) from the University of Melbourne, majoring in physics. Oshlack remained at the University of Melbourne for her PhD studies, which she completed on the topic of the central structure of radio quasars (1999-2003). Dr Oshlack continued in the Astrophysics Group at the University of Melbourne until later that year when she moved from using mathematics to look at the heavens to using mathematics to look at genetics. She made this transition at the Walter and Eliza Hall Institute where she worked as a research officer (2003-07) and then senior research officer (2007-11) in the Bioinformatics Division. Dr Oshlack has since moved to the Murdoch Children’s Research Institute in Melbourne where she is the head of the bioinformatics research group.
Dr Oshlack received the 2011 Ruth Stephens Gani medal from the Australian Academy of Science.
Bioinformatics? Microarrays? and other big words
You have been in the field of bioinformatics for a while now. Perhaps you could explain for us what it is.
It is a word that encompasses computational, statistical or mathematical descriptions of biology. It is using biological data and assessing biological data using those quantitative analysis procedures. So I feel that my role is really at the interface between data generation and understanding biology. There are lots of technologies today which can generate vast amounts of biological data. But we really want to understand biology. We want to understand diseases, we want to understand how medicines work and we want to understand evolution, amongst many, many biological questions. But to do that we need to be able to use these massive amounts of data. My role in bioinformatics is to use my skills to connect the two. So I need to be standing at the interface between the data and the biology.
In your postdoc, after you changed from astronomy to biology, you worked in microarrays. Perhaps you could explain for us how microarrays work and what kind of data they generate.
A microarray is a technology which is used to measure gene expression. In every cell in your body you have a copy of your DNA. However, different cells in your body are doing different things. So your skin cell is very different from your eye cell, which is very different from your heart or your liver cells. Your different cells have got lots of different functions, yet they all contain the same DNA. So what is the difference between the cells? It is how these genes in the DNA are expressed. It is how the genes function. What microarrays can do is tell you how much of each gene is functioning at any given moment. A microarray will do this not just one gene at a time but all the genes in a genome simultaneously. There are around 20,000 genes in the human genome, so it is possible to look at 20,000 different genes all at once and see how much they are functioning. How they are 'expressing' – which means what the levels of that gene are, in that cell, at a particular time.
You are looking at the expression of potentially thousands of different genes in a cell at any one time. How do you then make sense of all of that information?
You have to design an experiment very carefully in order to look at a question that you are really interested in. As an example, you might say, ‘Are genes in cancer cells functioning in the same way as genes in a normal cell?’ Say you are looking at liver cancer – you want to know whether a liver cell is functioning in the same way as a liver cancer cell. So we look at all the genes in a normal liver cell and we compare them to all the genes in a liver cancer cell. We use lots of statistical techniques that we have developed to look at the expression level changes between the things that we are interested in. Basically you have to design an experiment with a specific question in mind to be able to then analyse all this data in a meaningful way.
Focus questions
Select activities that are most appropriate for your lesson plan or add your own. These activities align with the Australian Curriculum strands ‘Science Understanding’, ‘Science as a Human Endeavour’ and ‘Science Inquiry Skills’, as well as the New South Wales syllabus Stage 5 Science outcome 5.8.2 and Stage 6 Biology outcome 9.4.6, 9.7.4 and 9.7.8. You can also encourage students to identify key issues in the preceding extract and devise their own questions or topics for discussion.
bioinformatics
cell
data
DNA
expression
gene
genome
microarray
statistics
© 2025 Australian Academy of Science