
Contents
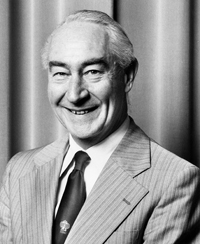
View Professor Andrew Cole's photo gallery
You can order the DVD from the Academy for $15 (including GST and postage)
Professor Andrew Cole was interviewed in 2010 for the Interviews with Australian scientists series. By viewing the interviews in this series, or reading the transcripts and extracts, your students can begin to appreciate Australia's contribution to the growth of scientific knowledge and view science as a human endeavour. These interviews specifically tie into the Australian Curriculum sub-strand ‘Nature and development of science’.
The following summary of Cole’s career sets the context for the extract chosen for these teachers’ notes. The extract discusses the experimental set-up for measuring infra-red absorption and how Cole used these measurements to determine molecular structure. Use the focus questions that accompany the extract to promote discussion among your students.
Andrew Reginald Howard (Andy) Cole was born in Perth, Western Australia in 1924. He qualified for a place at Perth’s only selective school, Perth Modern School, in 1937. After finishing secondary school in 1941, Cole was awarded a government university exhibition to study at the University of Western Australia (1942-46). Cole graduated with a BSc (Hons) in chemistry for his work on the clay, alunite. In 1946, Cole received a Hackett studentship which enabled him to study in England. After spending a year doing further research in Western Australia, Cole took up this studentship at St John’s College, Oxford (1947-49). His DPhil research focused on the infra-red absorption of molecules as well as advancing infra-red instrumentation.
In 1950 Cole moved again, to take up a position as postdoctoral research fellow at the National Research Council of Canada in Ottawa. While in Canada, Cole worked on solving the structure of steroids using infra-red spectroscopy. Cole was awarded a Nuffield research fellowship and returned to the University of Western Australia in 1952. He was subsequently appointed senior lecturer in chemistry (1955-57), reader in chemistry (1958-68), personal professorship in physical chemistry (1969) and head of department (1971-89). During his long career Cole made many advances in the field of infra-red spectroscopy, both in terms of using the technology to answer scientific questions and in terms of instrument development.
Professor Cole has been acknowledged with the awarding of many honours, including; fellowship to the Royal Australian Chemical Institute (1956), Liversidge lecturer (1962), Archibald D. Olle Prize (1978) and Leighton Memorial medal (1983) from the Royal Australian Chemical Institute, honorary fellowship to the New Zealand Institute of Chemistry and the Canadian Institute of Chemistry (1982), doctor of science from the University of Oxford (1983) and the University of Western Australia (1992) and the Centenary medal (2002). Cole was elected a Fellow of the Australian Academy of Science in 1974 and he served as councillor (1979-82) and vice-president (1981-82).
DPhil @ Oxford
Tell me about the early development at Oxford and who influenced you to commit to spectroscopy.
I had arranged to work with Tommy Thompson, who was their expert in infra-red spectroscopy, and he had quite a large group working on honours degrees and PhDs. The equipment in Oxford in those days was pretty crude. An infra-red spectrometer had, as its central point, a prism for dispersing the infra-red radiation. Ordinary spectrometers – by ‘ordinary’ I mean visible and ultraviolet – used prisms of glass or quartz in different wavelength regions, but neither of those prism materials was very transparent in the infra-red. Infra-red spectrometers were based on a prism of a very strange material in this respect: rock salt, sodium chloride crystal. For different wavelengths, other prisms of potassium bromide, lithium fluoride, calcium fluoride and caesium bromide and chloride were used. Many of these, other than lithium fluoride and calcium fluoride, are quite soluble in water. They could be polished to give a good optical surface, but water vapour in the atmosphere led to deterioration of the crystal polish. One had to be fairly careful not to breathe on the prism and to take some precautions to reduce the amount of water vapour in the air inside the spectrometer.
In those days we tried to dry the air in the spectrometer using water absorption materials like phosphorus pentoxide and also soda lime, which would also reduce the amount of carbon dioxide. Carbon dioxide was a problem because molecules like water vapour and carbon dioxide had their own infra-red absorption, which interfered with whatever we were trying to measure, so we had to reduce the amount of those in the spectrometer.
I carried out a number of projects as part of my DPhil program. One was measuring the intensities of infra-red absorption bands in a selected group of compounds related to benzene. The intensity of an infra-red absorption band is related to the change of dipole moment in the molecule while it’s vibrating. You can have stretching vibrations of the atoms and you can have bending vibrations etc. Anyway, I was measuring intensities of absorptions and calculating dipole moments from them. It wasn’t the normal method of measuring dipole moments, but it was a useful approach.
The other type of approach to infra-red absorption was the application to organic chemistry. Complex organic compounds had very complicated patterns of vibration. Some of those vibrations were localised in substituent groups, such as hydroxyl groups and carbonyl groups etc, and one could identify the presence of these substituent groups by the existence or otherwise of one or two strong absorption bands in the infra-red spectrum. I did a few of those types of measurement but not all that many.
The other things I studied were molecules with only six, eight or 10 atoms, things like the molecule of glyoxal. Glyoxal with two CHO groups, six atoms, was often described as the ‘simplest coloured organic compound’. By being coloured, it meant that it absorbed in the visible part of the spectrum, but I was studying its vibrations in the infra-red part of the spectrum. The two aldehyde groups making up the molecules could be oriented in the trans-form, where the substituent groups were opposite, or the cis-form, where they were turned over and existed in that other form. It wasn’t known exactly at that time which way the molecular structure lay. It was thought that it was a planar molecule; in the trans-form. If so, it had a centre of symmetry which influenced the number of vibrations which were active – that is, caused absorption – in the infra-red. In the cis-form of the molecule it would not have a centre of symmetry and more of the vibrations would be infra-red active than in the trans-form. As it turned out, the measurements that I made showed pretty clearly that the molecule had the trans structure. That, in itself, was useful information.
Focus questions
Select activities that are most appropriate for your lesson plan or add your own. These activities align with the Australian Curriculum strand ‘Science Inquiry Skills’ and the New South Wales syllabus Stage 5 Science outcome 5.6.1, Stage 6 Senior Science outcome 9.4.2 and Stage 6 Chemistry outcome 9.8.2. You can also encourage students to identify key issues in the preceding extract and devise their own questions or topics for discussion.
absorption
cis
glyoxal
infra-red
prism
spectrometer
stereoisomers
trans
vibration
wavelength
© 2025 Australian Academy of Science
