
 by
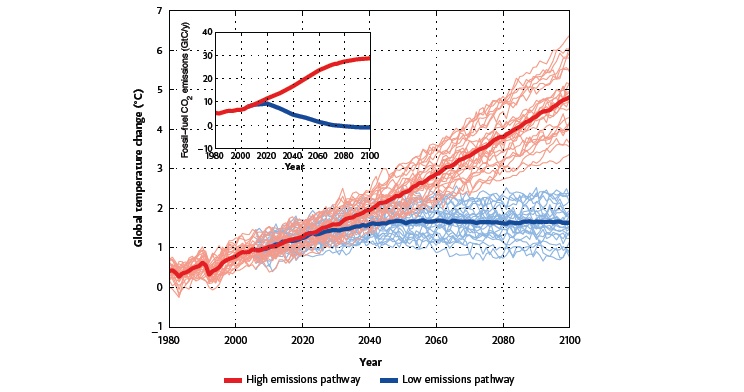
byIf society continues to rely on fossil fuels to the extent that it is currently doing, then carbon dioxide (CO2) concentrations in the atmosphere are expected to double from pre-industrial values by about 2050, and triple by about 2100. This ‘high emissions’ pathway for CO2, coupled with rises in the other greenhouse gases, would be expected to result in a globalaverage warming of around 4.5°C by 2100, but possibly as low as 3°C or as high as 6˚C. A ‘low emissions’ pathway, based on a rapid shift away from fossil fuel use over the next few decades, would see warming significantly reduced later this century and beyond (Figure 4.1).
During the next few decades and beyond, global warming is expected to cause further increases in atmospheric moisture content, more extreme heatwaves, fewer frosts, further decreases in the extent and thickness of sea ice, further melting of mountain glaciers and ice sheets, shifts in rainfall (increases in most tropical and high-latitude regions and decreases in many subtropical and mid-latitude regions), further ocean warming, and further rises in sea levels. The magnitude of expected change depends on future greenhouse gas emissions and climate feedbacks.
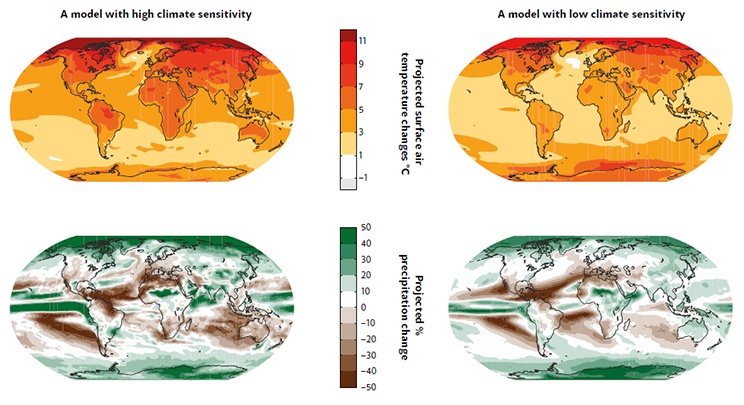
Future projections, based on climate models operated across a large number of research centres worldwide, broadly agree on the patterns of global-scale warming, with greater atmospheric warming over land than over the oceans, and greater warming at high northern latitudes than in the tropics and Southern Ocean (Figure 4.2 top). Future changes depend on the emissions pathway, and will be less if emissions are curtailed than under a high emissions scenario. At more localised regional scales the models can produce different results: for example, some models project substantial changes to phenomena such as El Niño or dramatic changes to vegetation, and regional projections of precipitation vary between models (Figure 4.2 bottom).
 by Nick Pitsas
Australian temperatures are expected to rise by approximately half a degree or more by 2030 relative to 1990, bringing more hot days and nights. Average sea level is expected to be about 15 cm higher by 2030 relative to 1990 and some models project tropical cyclones becoming less frequent but more severe in peak rainfall intensity as the world warms.
It is likely that future rainfall patterns across Australia will be different from today. However, compared with temperature trends, changes in rainfall patterns are harder to predict. Regional rainfall projections from different climate models are frequently different from one another (e.g. over Australia; Figure 4.2). Nevertheless, some future trends are projected by a majority of models, including decreases over southwest Western Australia coastal regions. Future rainfall trends across the Murray Darling basin remain uncertain.
Changes in rainfall greatly affect water availability because changes in rainfall are amplified in the resulting changes in runoff to rivers: the runoff in typical Australian catchments changes by 2 to 3% for each 1% change in rainfall.
 by Sardaka
The decisions we make on carbon emissions over coming decades will affect our climate for a long time to come, as emissions will profoundly impact the rate of future climate change, particularly after 2030 (Figure. 4.1). Even if emissions of greenhouse gases are reduced to near zero during this century, we will have to live with a warmer climate for centuries. For those parts of the climate system that respond slowly, such as the deep ocean, ice sheets and permafrost, change will continue for a long time. Many associated impacts—such as sea-level rise— and processes that exacerbate climate change—such as releases of methane and CO2 from thawing permafrost soils—will continue long after emissions are stopped.
These characteristics of the climate system mean that the only way to stop human-induced climate change (without resorting to ‘geoengineering’—the deliberate, large-scale modification of climate) is to reduce net greenhouse gas emissions to near-zero levels. The longer this takes to achieve, and the more greenhouse gases that are emitted in the meantime, the larger the scale of future climate change.
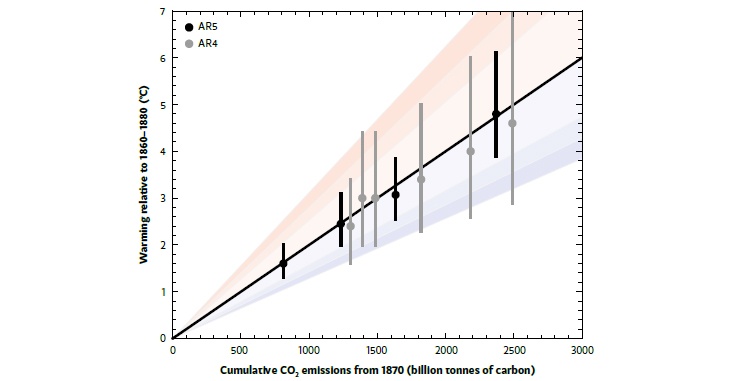
The amount of future global warming is closely related to cumulative CO2 emissions (Figure 4.3). For example, to have a 50:50 chance of keeping global average temperatures to no more than 2°C above preindustrial levels, the total CO2 emitted from human activities (accounting also for effects of other gases) would have to stay below a ‘carbon quota’ between 820 and 950 billion tonnes of carbon. So far, humanity has emitted well over half of this quota: between 1870 and 2013 cumulative emissions were 530 billion tonnes. The remaining quota is equivalent to around 30 years worth of current emissions. To stay within such a carbon quota, long-term global emissions reductions would have to average between 5.5% and 8% per year, accounting for time required to turn around present emissions growth.
© 2026 Australian Academy of Science
