
 by Robert Montgomery
Sea level was between 5 metres and 10 metres above current levels during the last interglacial period (129,000 to 116,000 years ago) when global average surface temperatures were less than 2°C above their values just before the start of the industrial era in the 19th century. The estimated contributions from ocean thermal expansion and a then smaller Greenland Ice Sheet imply a contribution also from Antarctica to this higher sea level.
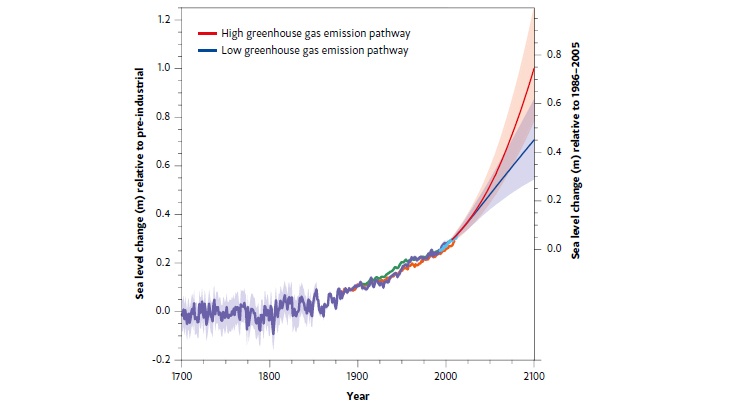
For two thousand years before the mid-19th century, the long-term global sea-level change was small, only a few centimetres per century. Since then, the rate of rise has increased substantially; from 1900 to 2012, sea level rose by a global average of about 19 centimetres. In the past 20 years, both satellite and coastal sea-level data indicate that the rate of rise has increased to about 3 centimetres per decade. A similarly high rate was experienced in the 1920 to 1950 period (Figure 6.1).
The two largest contributions to sea-level rise since 1900 were the expansion of ocean water as it warmed, and the addition of water to the ocean from loss of ice from glaciers. Since 1990, there have been further contributions from surface melting of the Greenland ice sheet, and the increased discharge of ice into the ocean from both the Greenland and Antarctic ice sheets. This increase in ice-sheet discharge is related to increases in ocean temperatures adjacent to and underneath the glacier tongues and floating ice shelves that fringe the coast of Greenland and Antarctica. The sum of storage of water in terrestrial reservoirs and the depletion of ground water have made a small contribution to sealevel rise during the 20th century.
Around the Australian coastline, sea level rose relative to the land throughout the 20th century, with a faster rate (partly as a result of natural climate variability) since 1993. This follows several thousand years when there was a slow fall of Australian sea levels relative to the land at rates of a few centimetres per century. This was a result of ongoing changes to the ‘solid’ Earth following loss of the large surface loading from ice sheets of the last ice age.
By 2100, it is projected that the oceans will rise by a global average of 28 to 61 centimetres relative to the average level over 1986–2005 if greenhouse gas emissions are low, and by 52 to 98 centimetres if emissions are high (Figure 6.1). The largest contributions are projected to be ocean thermal expansion and the loss of ice from glaciers, with the Greenland ice sheet contributing from surface melt and ice discharge into the ocean. For Antarctica, increased snowfall may partially offset an increase in discharge of ice into the ocean. Observations indicate that an increased discharge from Antarctica is occurring, particularly from sectors of the Antarctic ice sheet resting on land below sea level. Recent models successfully simulate increased flow in individual Antarctic glaciers and support the rates of ice sheet loss that were used to estimate global sea level rise of up to 98 cm by 2100. However, the relevant ice-sheet processes are poorly understood and an additional rise of several tens of centimetres by 2100 cannot be excluded.
Regional sea-level change can be different from the global average because of changes in ocean currents, changes in regional atmospheric pressure, the vertical movement of land, and changes in the Earth’s gravitational field as a result of changes in the distribution of water, particularly ice sheets, on the Earth. For Australia, 21st century sea-level rise is likely to be close to the global average rise.
In addition to climate-driven sea-level change, local factors can also be important and may dominate at some locations. These include tectonic land movements and subsidence resulting from the extraction of ground water or hydrocarbons, sediment loading and compaction. Changes in sediment supply can affect local erosion/accretion of the coastline.
Rising average sea levels mean that extreme sea levels of a particular height are exceeded more often during storm surges. For the east and west coasts of Australia, this happened three times more often in the second half compared to the first half of the 20th century. This effect will continue with more than a ten-fold increase in the frequency of extreme sea levels by 2100 at many locations and a much increased risk of coastal flooding and erosion, even for a low emissions pathway.
By 2300, it is projected that high greenhouse gas emissions could lead to a global sea-level rise of 1 metre to 3 metres or more. This may be an underestimate because it is difficult to accurately simulate the changes in the discharge from the Antarctic and Greenland ice sheets.
Sustained warming would lead to the near-complete loss of the Greenland ice sheet over a thousand years or more, contributing up to about 7 metres to global average sea-level rise. This would occur above a warming threshold estimated to be between about 1°C and 4°C of global average warming relative to pre-industrial temperatures. It is possible that a larger sea-level rise could result from a collapse of sectors of the Antarctic ice sheet resting on land below sea level. Current understanding is insufficient to assess the timing or magnitude of such a multi-century contribution from Antarctica, although there is increasing evidence that it may already have commenced.
© 2026 Australian Academy of Science
