

Atmospheric concentrations of carbon dioxide (CO2), methane and nitrous oxide began to rise around two hundred years ago, after changing little since the end of the last ice age thousands of years earlier. The concentration of CO2 has increased from 280 parts per million (ppm) before 1800, to 396 ppm in 2013. This history of greenhouse gas concentrations has been established by a combination of modern measurements and analysis of ancient air bubbles in polar ice (Box 2.1).
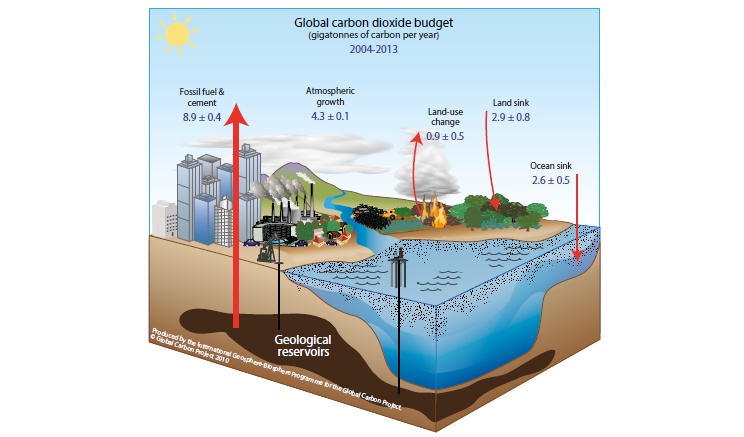
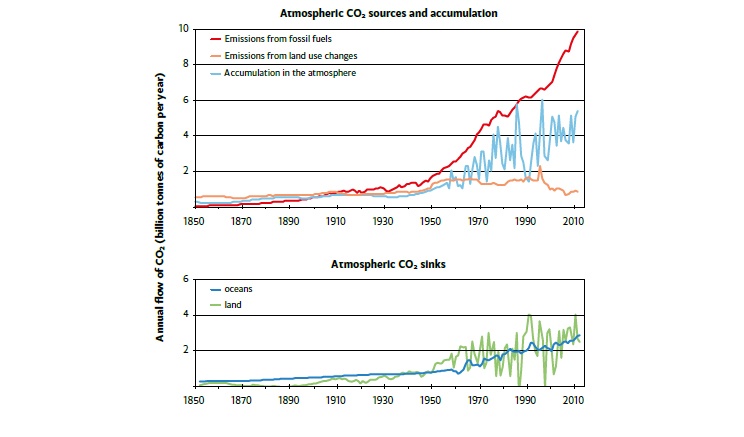
Particularly important is CO2. Enormous amounts of it are continually exchanged between the atmosphere, land and oceans, as land and marine plants grow, die and decay, and as carbon-rich waters circulate in the ocean. For several thousand years until around 200 years ago, this ‘carbon cycle’ was approximately in balance and steady. Since the 19th century, human-induced CO2 emissions from fossil fuel combustion, cement manufacture and deforestation have disturbed the balance, adding CO2 to the atmosphere faster than it can be taken up by the land biosphere and the oceans (Figures 3.1 and 3.2). On average over the last 50 years, about 25% of total CO2 emissions were absorbed by the ocean making sea water more acidic and 30% was taken up on land, largely by increased plant growth stimulated by rising atmospheric CO2, increased nutrient availability, and responses to warming and rainfall changes (though the mix of these mechanisms remains unclear). The other 45% of emissions accumulated in the atmosphere. These changes to the carbon cycle are known from measurements in the atmosphere, on land and in the ocean, and from modelling studies.
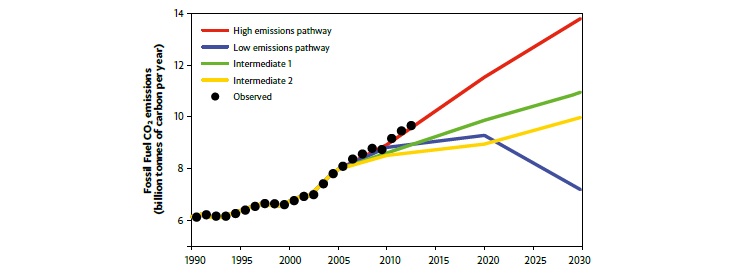
The dominant cause of the increasing concentration of CO2 in the atmosphere is the burning of fossil fuels. Over the last two centuries, the growth of fossilfuel combustion has been closely coupled to global growth in energy use and economic activity. Fossilfuel emissions grew by 3.2% per year from 2000 to 2010 (Figure 3.3), a rapid growth that is dominated by growth in Asian emissions and has exceeded all but the highest recent long-range scenarios for future emissions.
Although fossil-fuel emissions of CO2 have grown fairly steadily, the upward march of the CO2 concentration in the atmosphere varies from year to year. This is caused mainly by the effects of weather variability on vegetation, and also by sporadic volcanic activity: major volcanic eruptions have a significant indirect influence on atmospheric CO2 concentrations, causing temporary drawdown of CO2 through the promotion of plant growth by the light-scattering and cooling effects of volcanic haze. By contrast, the direct contribution of volcanic emissions to atmospheric CO2 is negligible, amounting to around 1% of current humaninduced emissions.

 by Jim Vrckovski
Climatic warming or cooling arises from changes in the flows of energy through the climate system (Figure 1.1) that can originate from a number of possible driving factors. The main drivers that have acted over the last century are:
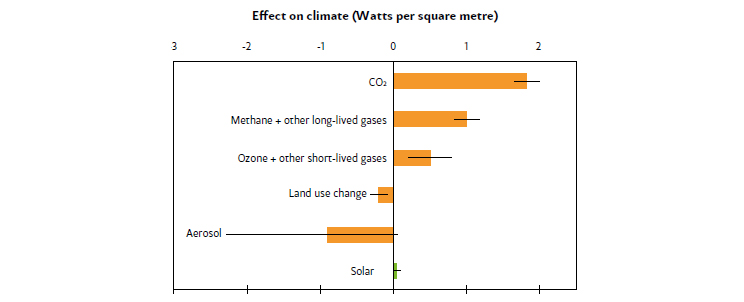
Of these, solar fluctuations and volcanic eruptions are entirely natural, while the other four are predominantly caused by human influences. The human-induced drivers have been dominant over the past century (Figure 3.4). Changes in greenhouse gas concentrations, dominated by CO2, caused a large warming contribution. Some of this has been offset by the net cooling effects of increased aerosol concentrations and their impact on clouds. Black carbon or soot has probably exerted a smaller, warming influence. The net effect of all aerosol types including soot remains hard to quantify accurately. Among the natural influences, the effect of changes in the brightness of the Sun has been very small (Box 3.1). Volcanic influences are highly intermittent, with major eruptions (such as Pinatubo in 1991) causing significant cooling for a year or two, but their average effects over the past century have been relatively small.
In comparison with other influences, the effects of solar variations on present global warming are small. Indirect estimates suggest that changes in the brightness of the Sun have contributed only a few percent of the global warming since 1750. Direct measurements show a decreasing solar intensity over recent decades, opposite to what would be required to explain the observed warming. Solar activity has declined significantly over the last few years, and some estimates suggest that weak activity will continue for another few decades, in contrast with strong activity through the 20th century. Nevertheless, the possible effects on warming are modest compared with anthropogenic influences.
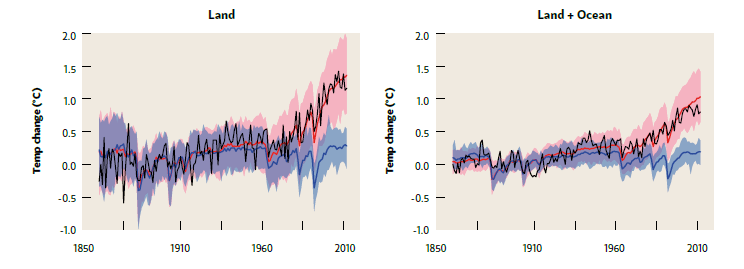
Using climate models, it is possible to separate the effects of the natural and human-induced influences on climate. Models can successfully reproduce the observed warming over the last 150 years when both natural and human influences are included, but not when natural influences act alone (Figure 3.5). This is both an important test of the climate models against observations and also a demonstration that recent observed global warming results largely from human rather than natural influences on climate.
It is also possible to distinguish the effects of different human and natural influences on climate by studying particular characteristics of their effects. For example, it was predicted more than a century ago that increases in CO2 would trap more heat near the surface and also make the stratosphere colder. In recent years, satellite and other measurements have provided strong evidence that the upper atmosphere has cooled and the lower atmosphere has warmed significantly—the predicted consequence of extra greenhouse gases. This supports the inference that the observed nearsurface warming is due primarily to an enhanced greenhouse effect rather than, say, an increase in the brightness of the Sun.
 by Robert Kerton
Modelling studies indicate that rising greenhouse gases have made a clear contribution to the recent observed warming across Australia. Depletion of the ozone layer in the upper atmosphere over Antarctica and rising greenhouse gas concentrations are also likely to have contributed significantly to climate trends that have been observed in the Australian region over the past two decades. These include stronger westerly winds over the Southern Ocean, strengthening of the high-pressure ridge over southern Australia, and a related southward shift of weather systems. These trends are consistent with climate model projections, and are likely to be largely human-induced through a combination of increases in greenhouse gases and thinning of the ozone layer.
Past decadal trends in Australian rainfall (Question 2) cannot yet be clearly separated from natural climate variations, except in southwest Western Australia where a significant observed decline in rainfall has been attributed to human influences on the climate system.
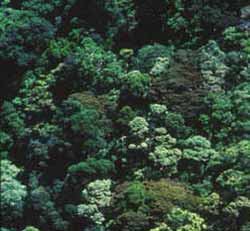
There has very likely been net uptake of CO2 by Australian vegetation, consistent with global uptake of CO2 by vegetation on land (Figure 3.2). This has been accompanied by increases in the greenness of Australian vegetation, which is also consistent with global trends.
© 2026 Australian Academy of Science
